The indicator widget displays one or two numeric values as a number, gauge or ticker. You can add additional titles and a colour-coded indicator icon representing the value, such as a green up arrow or a red down arrow.
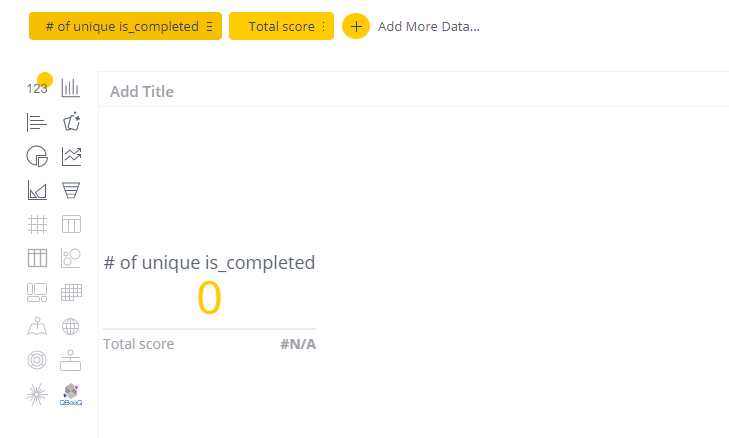
Adding data
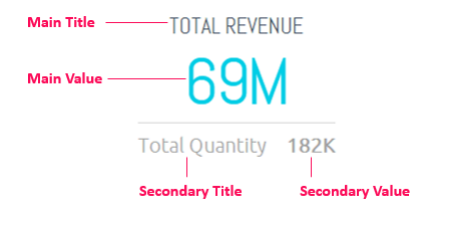
The indicator can handle up to two data sources. The first will be used as the main title and value and the second will be used as the secondary title and value.
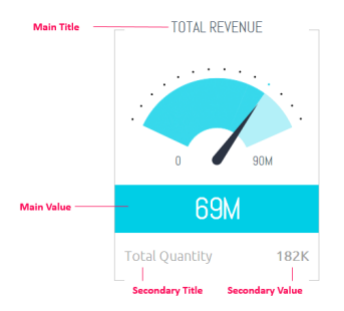
For a gauge, select the minimum and maximum values that can be represented by the gauge. These values can either be set as a fixed numeric value that you specify or as another numeric field that you select using the data browser (making the value dynamic). See below for instructions on displaying your indicator as a gauge.
Customisations
To change your indicator to a gauge and to customise the appearance of the gauge, click on Advanced Configuration and use the options in the left sidebar.
The colours and titles used in the indicator widget can be adjusted and you can use quick functions to show different data e.g. running sum, % change over time etc. Click here to read our full guide to customising widgets.